Introducing x_swing_and_miss_percent_plus
In the beginning of the season, I developed x_swing_and_miss_percent_plus (expected swing and miss percent plus), but I wanted to wait until the All-Star break to write about it. That time has come.
The goal of x_swing_and_miss_percent_plus is to quantify how a good pitcher’s stuff is — through the lens of inducing swings and misses — without directly considering that pitcher’s control and command. Although it matters, how pitch types interact with each other is also not a deliberate component. Unlike Cameron Grove (PitchingBot – An Overview) and Ethan Moore (xRV 3: The Final Update), both of whom did a great job, I focus only on expected swings and misses rather than expected run value to keep it simple.
It is very different from the predictive metrics I revised back in April, as it is a descriptive statistic, seeking to reveal what one would have expected to have happened. x_swing_and_miss_percent_plus is built off of a logistic regression model, the outputs of which are log-odds, which can be converted into traditional probabilities, that are derived from “a linear combination of one or more independent variables” (Wikipedia). In this case, the outputs of my logistic regression models are swing and miss probabilities, each pitch serving as an observation. I picked logistic regression because I have an understanding of how it works and my target variable has two outcomes (no swing and miss or swing and miss). No swing and miss is marked as a zero, and swing and miss is marked as a one. The predictive values in the form of probabilities will be no smaller than zero and no greater than one.
Before I ran any logistic regressions, I wanted to mathematically recreate pitch types. I decided to form six of them after some preliminary grouping using the names seen on Baseball Savant.

Then, I removed non- regular season pitches, knuckleballs, forkballs, eephuses, screwballs, pitchouts not put into play, intentional balls, and unsuccessful bunt attempts from my data, which was acquired using the baseballr package. When I update this metric after the 2023 season, I will remove successful bunt attempts.
After that, I mutated several of the variables — release_pos_x (horizontal release point), pfx_x (horizontal movement), vx0 (horizontal velocity), and ax (horizontal acceleration) — so that they would be independent of the arm with which the pitcher throws.
Next, I converted a number of variables, which I will list below, into z-scores:
- release_speed
- pfx_x_adjusted_p_throws (horizontal movement adjusted for the arm with which the pitcher throws)
- pfx_z (vertical movement)
- vx0_adjusted_p_throws (horizontal velocity adjusted…)
- vy0 (velocity in the y-direction)
- vz0 (velocity in the z-direction)
- ax_adjusted_p_throws (horizontal acceleration adjusted…)
- ay (acceleration in the y-direction)
- az (acceleration in the z-direction)
- release_spin_rate
At this point, I was ready to use k-means clustering, a technique for separating data into k number of groups, six in this case, using scaled variables. I utilized the kmeans function, available through the cluster package, on all the remaining pitches in my data from 2015 to 2020, 3,671,638 of them. I followed the lead of Ethan Moore, who in Baseball ProGUESTus: A Potential Alternative for Public Pitch Classification, used a k-means classifier on “more than 6,000 random pitches from 2015-2018 MLB right handed pitchers based on each pitch’s velocity, spin rate, vertical movement, horizontal movement, spin axis, and spin efficiency.” Moore, for the purpose of more precise statistical analysis, was trying to form new pitch types based on pitches’ characteristics rather than just going off of the ones provided by MLB, where in the latter instance, one can run into the issue of a pitcher’s x-pitch behaving like a y-pitch.
Here were the averages in the ten variables above for each of my pitch type clusters…

Once I had all the means, I could calculate the distance away each pitch in my data is from the six pitch type clusters. A pitch belongs to the cluster to which it is closest (smallest distance away).
pitch_type_cluster 1 is comprised of about 44% sliders, as classified by Statcast, and 42% curveballs.
pitch_type_cluster 2 is comprised of about 47% 4-seam fastballs, 21% sinkers, 11% cut fastballs, and 10% changeups.
pitch_type_cluster 3 is comprised of about 38% changeups, 22% sliders, 11% sinkers, and 10% 4-seam fastballs.
pitch_type_cluster 4 is comprised of about 32% 4-seam fastballs, 31% sinkers, and 26% changeups.
pitch_type_cluster 5 is comprised of about 40% sliders, 14% curveballs, 13% cut fastballs, 13% 4-seam fastballs, and 11% changeups.
pitch_type_cluster 6 is comprised of about 52% 4-seam fastballs and 34% sinkers.
With the six pitch type clusters established, I was in a position to ultimately generate six logistic regression models. I started each off with these explanatory variables…
- release_speed
- release_pos_x_adjusted_p_throws
- abs(absolute)(release_pos_x_adjusted_p_throws)
- release_pos_z
- abs(release_pos_z)
- total release_pos
- pfx_x_adjusted_p_throws
- abs(pfx_x_adjusted_p_throws)
- pfx_z
- abs(pfx_z)
- total pfx
- vx0_adjusted_p_throws
- abs(vx0_adjusted_p_throws)
- vy0
- abs(vy0)
- vz0
- abs(vz0)
- total v0
- ax_adjusted_p_throws
- abs(ax_adjusted_p_throws)
- ay
- abs(ay)
- az
- abs(az)
- total a
- release_spin_rate
- release_extension
Here’s what the output of the initial regression looked like…

I removed the three variables with NA p-values and reran the regression.

I removed release_pos_z next because it had the highest p-value and reran the regression. I continued to follow this procedure until all the variables were statistically significant at the .05 level.
Subsequently, I added squared terms, such as release_speed^2. Once all the variables were, again, statistically significant at the .05 level, I added terms to the third power and so on. The final regression output can be seen below…

Here is a graph of pitch_type cluster 1 swing_and_miss_percent_plus (swing and miss percent divided by league average and multiplied by 100) versus x_swing_and_miss_percent_plus (expected swing and miss percent divided by league average and multiplied by 100) for pitcher-seasons from 2015 to 2020 with at least 100 pitches…

League average for both plus stats is 100, and higher numbers are better.
Here is a graph for 2021…

pitch_type cluster 2


pitch_type cluster 3


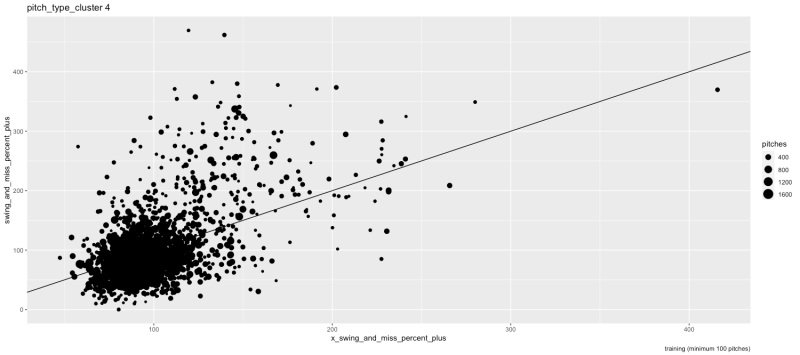
pitch_type cluster 4

pitch_type cluster 5


pitch_type cluster 6


To arrive at a pitcher’s x_swing_and_miss_percent_plus, one must add up the x_swing_and_miss_percent on all of that pitcher’s pitches, divide by the number of that pitcher’s pitches, divide by the league average swing and miss rate, and multiply by 100. As I alluded to earlier, the predictions don’t directly factor in differentials between pitch clusters because the inputs in the regressions are simply individual pitch stats. I didn’t want the expected swing and miss percentages in one pitch_type cluster to influence ones in other pitch_type clusters.
Here is a graph of of swing_and_miss_percent_plus versus x_swing_and_miss_percent_plus for pitcher-seasons from 2015 to 2020 with at least 100 pitches…
Here is a graph for 2021…

Even though x_swing_and_miss_percent_plus was designed to be descriptive, I thought it would be interesting to see how stable it is year-to-year and if it has any predictive value.
r-squared for consecutive player-seasons from 2015 to 2021
- swing_and_miss_percent_plus to swing_and_miss_percent_plus- .1867
- x_swing_and_miss_percent_plus to x_swing_and_miss_percent_plus- .5595
- x_swing_and_miss_percent_plus to swing_and_miss_percent_plus- .1284
- swing_and_miss_percent_plus and x_swing_and_miss_percent_plus to swing_and_miss_percent_plus- .2181
I am very pleased to see that x_swing_and_miss_percent_plus is significantly more consistent year-to-year than swing_and_miss_percent_plus is and x_swing_and_miss_percent_plus can help better predict future swing_and_miss_percent_plus.
Here are the top ten x_swing_and_miss_percent_plus marks on pitch types in pitch_type cluster 1 from 2015 to 2022 (minimum 500 pitches)…
- 2016 Lance McCullers Jr. KC (176)
- 2018 Sergio Romo SL (172)
- 2017 Lance McCullers Jr. KC (144)
- 2019 Collin McHugh SL (143)
- 2019 José Berríos CU (142)
- 2015 Lance McCullers Jr. KC (142)
- 2021 Charlie Morton CU (140)
- 2018 José Berríos CU (140)
- 2022 Charlie Morton CU (139)
- 2019 Shane Bieber KC (135)
2022 (minimum 100 pitches)
- Penn Murfee SL (162)
- Sonny Gray SL (160)
- Collin McHugh SL (155)
- Brooks Raley SL (152)
- Michael King SL (149)
- Scott Barlow CU (141)
- Sergio Romo SL (140)
- Charlie Morton CU (139)
- Jake Diekman SL (135)
- Mike Clevinger SL (134)
pitch types in pitch_type cluster 2 from 2015 to 2022 (minimum 500 pitches)
- 2017 Kenley Jansen FC (201)
- 2017 Josh Fields FF (195)
- 2015 Josh Fields FF (182)
- 2015 Garrett Richards FC (182)
- 2017 Carl Edwards Jr. FF (175)
- 2017 Pedro Báez FF (174)
- 2018 Kenley Jansen FC (171)
- 2018 Carl Edwards Jr. FF (170)
- 2015 Danny Duffy FF (168)
- 2018 Jacob deGrom FF (167)
2022 (minimum 100 pitches)
- Dylan Cease FF (172)
- Brusdar Graterol FC (169)
- Liam Hendriks FF (163)
- José Ruiz FF (151)
- Carl Edwards Jr. FF (148)
- Collin Poche FF (147)
- Emilio Pagán FF (143)
- Brandon Woodruff FF (143)
- Spencer Strider FF (142)
- Drew Rasmussen FF (142)
pitch types in pitch_type cluster 3 from 2015 to 2022 (minimum 500 pitches)
- 2021 Trevor Rogers CH (141)
- 2016 Drew Smyly CU (140)
- 2021 Kenta Maeda FS (139)
- 2021 Héctor Neris FS (137)
- 2021 Kevin Gausman FS (132)
- 2018 Kevin Gausman FS (131)
- 2015 Kyle Gibson CH (130)
- 2021 Wade Miley CH (129)
- 2018 Trevor Richards CH (129)
- 2016 Kevin Gausman FS (128)
2022 (minimum 100 pitches)
- Chasen Shreve FS (154)
- Héctor Neris FS (144)
- Kevin Gausman FS (138)
- Ian Anderson CU (137)
- Tony Gonsolin FS (136)
- Daniel Norris CH (134)
- Trevor Williams CH (133)
- Kyle Gibson CH (133)
- Daulton Jefferies CH (132)
- Dallas Keuchel CH (131)
pitch types in pitch_type cluster 4 from 2015 to 2022 (minimum 500 pitches)
- 2015 Chris Sale CH (167)
- 2016 Chris Sale CH (150)
- 2021 Josh Fleming SI (148)
- 2018 Jared Hughes SI (148)
- 2017 Chris Sale CH (146)
- 2019 Luis Castillo CH (145)
- 2018 Steve Cishek SI (143)
- 2019 Jared Hughes SI (143)
- 2021 Steve Cishek SI (134)
- 2019 Eduardo Rodriguez CH (132)
2022 (minimum 100 pitches)
- Devin Williams CH (421)
- Jackson Kowar CH (235)
- Trevor Richards CH (227)
- Steven Matz CH (212)
- Pablo López CH (163)
- Daniel Bard SI (159)
- Adam Cimber SI (158)
- Gerrit Cole CH (156)
- Charlie Morton CH (154)
- Sergio Romo SI (153)
pitch types in pitch_type cluster 5 from 2015 to 2022 (minimum 500 pitches)
- 2015 Garrett Richards SL (156)
- 2018 Luis Severino SL (137)
- 2018 Kyle Gibson SL (134)
- 2017 Luis Severino SL (133)
- 2016 Michael Pineda SL (132)
- 2017 Zack Greinke SL (131)
- 2017 Patrick Corbin SL (130)
- 2015 Tyson Ross SL (128)
- 2018 Patrick Corbin SL (128)
- 2018 Tyson Ross SL (128)
2022 (minimum 100 pitches)
- Craig Kimbrel KC (161)
- José Berríos CU (143)
- Paul Sewald SL (142)
- Joe Musgrove SL (138)
- Jake Diekman SL (136)
- Corbin Burnes SL (134)
- Brandon Woodruff SL (134)
- Evan Phillips SL (134)
- Andrew Chafin SL (133)
- Dany Jiménez SL (132)
pitch types in pitch_type cluster 6 from 2015 to 2022 (minimum 500 pitches)
- 2017 Brian Ellington FF (220)
- 2018 Edwin Díaz FF (208)
- 2019 Josh Hader FF (207)
- 2015 Craig Kimbrel FF (204)
- 2021 Michael Kopech FF (201)
- 2015 Aroldis Chapman FF (201)
- 2019 Gerrit Cole FF (200)
- 2017 Craig Kimbrel FF (196)
- 2018 Josh Hader FF (195)
- 2019 Edwin Díaz FF (189)
2022 (minimum 100 pitches)
- Spencer Strider FF (175)
- Drew Smith FF (172)
- Liam Hendriks FF (168)
- A.J. Minter FF (165)
- Michael Kopech FF (164)
- David Bednar FF (156)
- Gerrit Cole FF (156)
- Hunter Greene FF (156)
- Daniel Hudson FF (156)
- Tanner Rainey FF (152)
Here are the top ten x_swing_and_miss_percent_plus marks from 2015 to 2022 (minimum 1,250 pitches)…
- 2018 Josh Hader (153)
- 2019 Gerrit Cole (151)
- 2018 Luis Severino (146)
- 2022 Dylan Cease (144)
- 2021 Gerrit Cole (144)
- 2021 Tyler Glasnow (142)
- 2015 Garrett Richards (142)
- 2016 José Fernández (140)
- 2018 Gerrit Cole (140)
- 2022 Spencer Strider (139)
2022 (minimum 250 pitches)
- Devin Williams (198)
- Tanner Scott (153)
- Dylan Cease (144)
- Liam Hendriks (140)
- Paul Sewald (139)
- Spencer Strider (139)
- Craig Kimbrel (138)
- Tanner Rainey (136)
- Edwin Díaz (135)
- A.J. Minter (135)
Overall, I believe these results look pretty good. x_swing_and_miss_percent_plus is not perfect, of course. For example, it likes Dallas Keuchel too much

and Shane McClanahan not enough.

Most of the time, the expected swing and miss percentages for position players are horrible

but not always.

I’ve created a free Shiny application called Pitcher on which users can view and interact with this data.
If you have any questions or feedback, feel free to DM me on Twitter at MaxSportsStudio.
Featured image- Creator: Ron Vesely | Credit: Getty Images


