Who Is Josh Bell?

Will the real Josh Bell please stand up? Josh Bell has been an anomaly over the last few years. Once a highly touted prospect, who was selected in the second round out of a Texas high school in 2012, Bell breezed through the minor leagues posting well above average offensive seasons at every stop. Bell debuted late in 2016 as the Pirates tried to make a playoff push. In 2017, Josh’s rookie season, he posted a .255/.334/.466 (AVG/OBP/SLG) triple slash hitting 26 home runs in 620 plate appearances. In 2018 Bell posted a .261/.357/.411 line but with only 12 home runs in 583 PAs. Following a down second season he reworked his swing, refined his approach and slashed .277/.367/.569 with 37 home runs in 613 PAs1. So who is the real Josh Bell? To find that out we are going to have to take a look under the hood.
2017
| Stat | AVG | OBP | SLG | BB% | K% | wOBA | wRC+ |
| Line | .255 | .334 | .466 | 10.6% | 18.9% | .338 | 108 |
| Rank Among 1B (Qualified/28) | 19 | 20 | 17 | 18 | 10 | 21 | 20 |
Data from Fangraphs
After a cup of coffee in 2016, Bell played his first full season in 2017. Bell posted respectable numbers in his rookie season that were 8% above average by wRC+.Based on the surface level stats, Josh Bell’s debut strongly reflected his scouting report, specifically the plus hit tool and average to above-average power. Bell showed off his hit tool in his rookie year with a 26.7% O-swing, Good for 44th in the league out of 144 qualified hitters. Bell also put up 79.6% contact rate which was about league average but sandwiched between Tommy Pham and Christian Yelich. He also posted an 8.8% swinging strike rate which was the 59th best rate in all of baseball among qualified hitters1. While the plate discipline metrics reflected those of an above average hitter, his results skewed more average. Digging into his batted ball data provides some clarity as to why. Bell posted a 6.7% barrel rate, 73rd of 144 qualified batters, with a 87.7 MPH average exit velocity, good for just 83rd in the league. He also averaged an 8.6 degree launch angle which was well below league average as the 118th qualified batter. All of Bell’s batted ball data showed a league average or worse hitter, his expected slash line based on these metrics was .265/.344/.441 with a .340 xwOBA.2 All of this was in line with the results he posted in 2017 indicating that luck did not play too important a role in Bell’s season. Although the batted ball data was below average, Bell’s plate discipline led many people to believe there could be another level of performance yet to come.
2018
| Stat | AVG | OBP | SLG | BB% | K% | wOBA | wRC+ |
| Line | .261 | .357 | .411 | 13.2% | 17.8% | .336 | 111 |
| Rank Among 1B (Qualified/24) | 10 | 7 | 19 | 6 | 8 | 13 | 13 |
Data from Fangraphs
As mentioned earlier, entering 2018 many people were expecting a breakout from Bell, but a look at the surface level stats will tell you that he had an underwhelming season. Despite a drop in home runs from 26 in 2017 to just 12 in 2018, Bell’s wRC+ increased from 108 to 111. This is due to increasing his walk rate by 2.6% and decreasing his K rate by 1.1%,and increasing his OBP from .334 to .357. Despite the bump in his surface level plate discipline numbers, his underlying metrics remained very similar. Bell posted a 26.7% O-swing, 77.3% Contact Rate, and 9.7% swinging strike rate.1 Bell’s batted ball quality improved slightly in 2018, raising his barrel rate to 7.0% (72nd of 141), average exit velocity to 90MPH (37th of 141), and his launch angle to 9.2 degrees (110th of 141). These metrics produced an expected slash line of .260/.356/.420.2 With better batted ball data and similar plate discipline metrics, what happened to the power? Well a decrease in HR/FB from 19.1% in 2017 to 9.2% in 2018 accounts for the difference in home runs, as a 19.1% HR/FB would have resulted in 25 home runs.1 Following his sophomore season it was reasonable to expect that Josh Bell was going to be a league average hitter with 20-30 HR power. Then came 2019.
2019
| Stat | AVG | OBP | SLG | BB% | K% | wOBA | wRC+ |
| Line | .277 | .367 | .569 | 12.1% | 19.2% | .378 | 135 |
| Rank Among 1B (Qualified/20) | 8 | 6 | 2 | 9 | 6 | 5 | 4 |
Data from Fangraphs
In 2019 everything about Josh Bell changed at the plate. He hit 37 home runs while posting a career high in AVG, OBP, SLG, wOBA, and wRC+. Bell also posted a career high, but still well below league average K rate. The increase in surface level stats was accompanied by a radical change in approach, as well as batted ball data. Bell was more aggressive at the plate, posting a career high O-Swing of 30.2%, and swinging strike rate of 11.1%. He also posted a career low contact rate of 76.5%.1 All of these seem like bad things, but it is clear from the batted ball data that Bell was intentionally sacrificing some contact in order to increase his power. He raised his barrel rate to 12.7% (22nd of 156 qualified hitters), average exit velocity to 92.3 MPH (9th of 156), and launch angle to 13 degrees (85th of 156). Bell’s expected slash line in 2019 was an excellent .283/.373/.556 with a xwOBA of .381,2 indicating that Bell’s breakout season was well deserved.
Looking Forward
Entering his fourth full season in the majors it’s tough to know what to expect from Bell. In his first 2 seasons he was a contact-first batter with roughly 20 home run power. Then in 2019, he exhibited more power than he had at any point in his professional career, hitting 37 home runs, including moonshots like this one.

https://thumbs.gfycat.com/SeparateFilthyBighorn-mobile.mp4
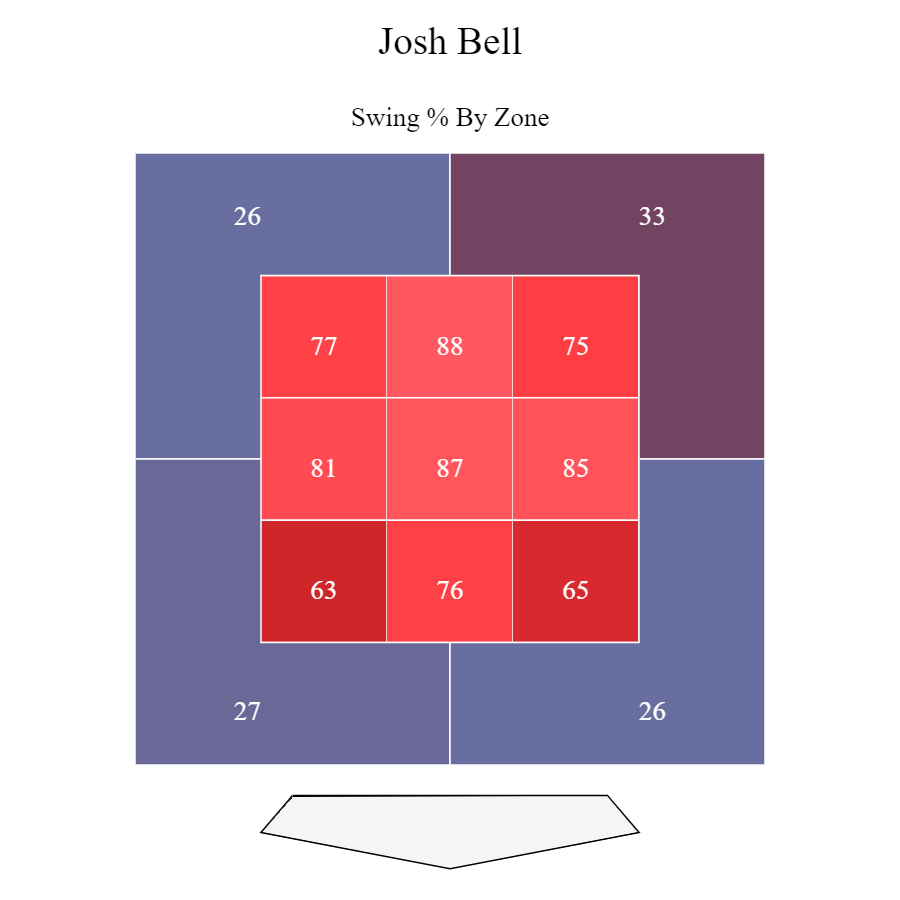
In one season Bell was able to go from 12 home runs to 37, all while increasing his AVG, and OBP. So how did he do it? The following charts show how Bell’s approach changed from 2017/2018 to his new approach in 2019.

Data provided by Fangraphs

Images From Baseball Savant
As you can see from the charts, Bell became more aggressive on pitches he could drive, increasing his swing and zone swing rates. The increased aggression on pitches in the zone lead to an increase in hard hit rate. Accompanying this change Bell also hit more balls in the air, decreasing his ground ball % from 48.5% in 2018 to 44% in 2019, resulting in increased power production1. Ben Clemens did a great job breaking down the stance and swing change Bell made in 2019 in order to increase his launch angle and tap into his power. The big question is whether or not Bell can sustain the strides he made in 2019 into 2020 and beyond. The Steamer and ATC projection systems seem to think he can, as indicated by the chart below.
| AVG | OBP | SLG | HR | BB% | K% | wOBA | wRC+ | |
| ATC | .274 | .369 | .528 | 32 | 12.1% | 18.8% | .373 | 132 |
| Steamer | .274 | .369 | .503 | 29 | 12.7 | 18.9 | .362 | 124 |
Projections from Fangraphs
Given the fact that projection systems are intended to predict median outcomes a projected slash line for Bell of .275/.369/.528 is extremely encouraging. Based on the improvements made in 2019 and faith that the projection systems have in him, the Pirates and Fantasy owners alike can likely count on Josh Bell to provide a well above average offensive season.
1 stats provided by Fangraphs
2 stats provided by Baseball Savant


