Introducing a new and improved pK%+ (Pitchers)
In the last week, I’ve reintroduced two improved pitching metrics: pwOBAcon+ and pBB%+. I will now give an update on predictive strikeout percent plus (pK%+), which I posted about almost a year ago.
There are five variables that go into calculating pK%+: heart whiff percent plus, shadow swing percent plus, shadow swing percent plus^2, chase whiff percent plus, fastball velocity plus^2, and strikeout percent plus.
I did my best to exclude pitches that resulted in catcher interference, a sacrifice bunt, a missed bunt, a bunt foul-tip, a foul bunt, a swinging pitchout, or a foul pitchout when it was convenient to do so. Additionally, I removed all pitches thrown in plate appearances that ended in a bunt. I excluded pitchouts and intentional balls as well. I did this for pBB%+ also.
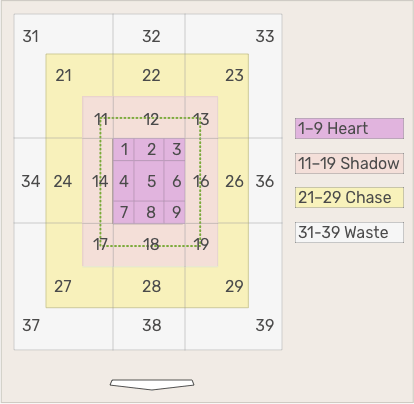
I tried to replicate these attack zones, but Statcast’s numbers will differ from my calculations slightly.
Here are the lowest single-season heart whiff percent plus marks since 2015
- Iván Nova 2016 (53.9)
- Iván Nova 2019 (57.2)
- Mike Leake 2017 (57.5)
- Justin Nicolino 2016 (57.9)
- A.J. Burnett 2015 (59.0)
- Jaime García 2018 (59.2)
- Taylor Rogers 2016 (59.3)
- Mike Leake 2015 (59.4)
- Bryan Mitchell 2018 (60.7)
- Bartolo Colon 2018 (60.8)
Highest
- Josh Hader 2018 (185.4)
- Aroldis Chapman 2016 (183.7)
- Josh Hader 2019 (182.9)
- Antonio Bastardo 2015 (174.5)
- Aroldis Chapman 2015 (169.5)
- Colin Poche 2019 (167.3)
- Josh Hader 2017 (166.6)
- Kenley Jansen 2015 (161.4)
- Seunghwan Oh 2016 (161.1)
- Aroldis Chapman 2018 (161.0)
Here are the lowest single-season shadow swing percent plus marks since 2015
- Dellin Betances 2017 (84.7)
- Adam Wainwright 2019 (88.3)
- Adam Ottavino 2017 (89.4)
- Kyle Hendricks 2016 (89.5)
- Steven Matz 2018 (89.8)
- Jhoulys Chacín 2018 (90.1)
- José Quintana 2018 (90.5)
- Adam Ottavino 2019 (90.9)
- Mike Bolsinger 2015 (90.9)
- Alex Meyer 2018 (91.0)
Highest
- Jared Hughes 2018 (111.5)
- Sean Doolittle 2019 (110.7)
- Masahiro Tanaka 2017 (110.5)
- Josh Hader 2019 (110.5)
- Max Scherzer 2015 (110.4)
- Zach Neal 2016 (110.3)
- Jared Hughes 2015 (110.2)
- Kevin Gausman 2019 (110.1)
- Pedro Báez 2017 (110.1)
- Jared Hughes 2016 (109.7)
Here are the lowest single-season chase whiff percent plus marks since 2015
- Mark Buehrle 2015 (59.0)
- Bartolo Colon 2016 (65.6)
- Bartolo Colon 2015 (65.6)
- Bartolo Colon 2018 (67.2)
- Marco Estrada 2015 (69.1)
- Doug Fister 2015 (69.2)
- R.A. Dickey 2017 (71.7)
- Blaine Boyer 2016 (71.8)
- Martín Pérez 2015 (72.0)
- Andrew Albers 2017 (72.3)
Highest
- Dellin Betances 2015 (138.2)
- Tyson Ross 2015 (138.0)
- Ken Giles 2016 (137.1)
- Francisco Liriano 2015 (135.8)
- Ryan Pressly 2018 (134.6)
- Andrew Miller 2015 (133.5)
- Zack Britton 2016 (132.1)
- Carson Smith 2015 (131.6)
- Luke Gregerson 2016 (131.2)
- Carter Capps 2015 (130.5)
A pitch was considered a fastball if it was a sinker, two-seam fastball, four-seam fastball, or cutter.
Here are the lowest single-season fastball velocity plus marks since 2015
- John Ryan Murphy 2019 (84.9)
- Hernán Pérez 2018 (87.4)
- Kazuhisa Makita 2018 (89.4)
- Chris Gimenez 2017 (89.6)
- Mark Buehrle 2015 (90.1)
- Chris Gimenez 2018 (90.1)
- Jered Weaver 2016 (90.8)
- Chris Owings 2019 (90.8)
- R.A. Dickey 2015 (91.1)
- Jered Weaver 2015 (91.4)
Highest
- Aroldis Chapman 2016 (108.3)
- Jordan Hicks 2018 (108.1)
- Aroldis Chapman 2015 (107.6)
- Mauricio Cabrera 2016 (107.4)
- Aroldis Chapman 2017 (107.3)
- Jordan Hicks 2019 (107.0)
- Kelvin Herrera 2015 (106.3)
- Joe Kelly 2018 (106.3)
- Tayron Guerrero 2018 (106.3)
- Aroldis Chapman 2018 (106.3)
Here are the lowest single-season strikeout percent plus marks since 2015
- Ty Blach 2017 (60.7)
- Mike Pelfrey 2016 (62.6)
- Brett Anderson 2019 (62.8)
- Justin Nicolino 2015 (63.0)
- Mark Buehrle 2015 (63.3)
- Martín Pérez 2016 (65.2)
- Andrew Cashner 2017 (65.8)
- Ariel Jurado 2018 (66.8)
- Blaine Boyer 2016 (67.2)
- Mike Pelfrey 2015 (67.8)
Highest
- Craig Kimbrel 2017 (171.4)
- Josh Hader 2018 (165.6)
- Andrew Miller 2016 (163.8)
- Josh Hader 2019 (163.5)
- Aroldis Chapman 2015 (159.8)
- Dellin Betances 2016 (158.7)
- Gerrit Cole 2019 (158.4)
- Dellin Betances 2015 (157.8)
- Edwin Díaz 2018 (156.7)
- Andrew Miller 2015 (154.2)
pK%+ comes from a linear regression where heart whiff percent plus, shadow swing percent plus(^2), chase whiff percent plus, fastball velocity plus, and strikeout percent plus in season n were the x-variables and non-adjusted (not regressed) strikeout percent plus in season n+1 was the y-variable. A pitcher’s pK%+ value is what one would predict that pitcher’s non-adjusted strikeout percent plus to be the following season given that pitcher’s heart whiff percent plus, shadow swing percent plus, chase whiff percent plus, fastball velocity plus, and strikeout percent plus.
Increases in heart whiff percent plus, shadow swing percent plus^2, chase whiff percent plus, fastball velocity plus^2, and strikeout percent plus in season n are associated with an increase in non-adjusted strikeout percent plus in season n+1. Getting more swings and misses and throwing harder resulting in a higher predictive strikeout percent plus is not surprising. An increase in shadow swing percent plus corresponds to a decrease in non-adjusted strikeout percent plus.
In an effort to better grasp the effect of shadow swing percent plus on predictive strikeout percent plus, I examined how changes in shadow swing percent plus impact pK%+. I made all the other variables league average.
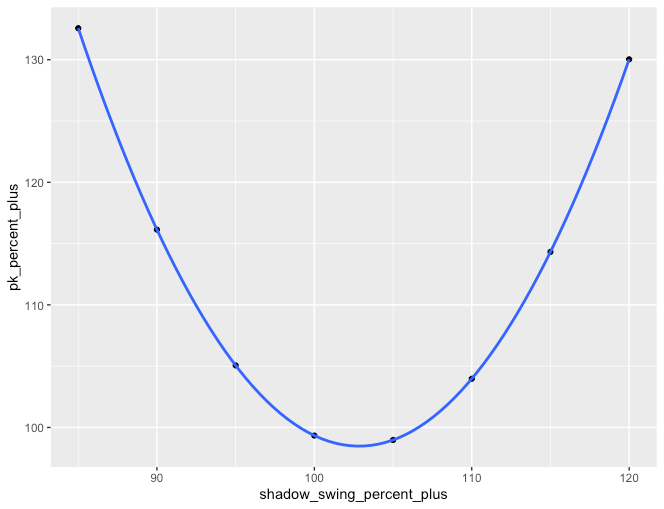
Based on the graph, one can see that is better for a pitcher — at least in terms of strikeouts — to either get a lot of swings in the shadow zone or to get very few.
Here are the lowest single-season predictive strikeout percent plus marks since 2015
- Mark Buehrle 2015 (47.7)
- Justin Nicolino 2015 (57.5)
- Bartolo Colon 2018 (59.4)
- Brett Anderson 2019 (61.5)
- Justin Nicolino 2016 (61.8)
- Iván Nova 2019 (63.6)
- Paul Blackburn 2017 (64.7)
- Jered Weaver 2016 (64.7)
- Kyle Kendrick 2015 (65.2)
- Mike Leake 2019 (65.3)
Highest
- Dellin Betances 2017 (178.3)
- Dellin Betances 2016 (178.0)
- Craig Kimbrel 2017 (176.2)
- Dellin Betances 2015 (172.2)
- Josh Hader 2019 (172.1)
- Josh Hader 2018 (168.5)
- Aroldis Chapman 2015 (167.1)
- Edwin Díaz 2018 (161.2)
- Aroldis Chapman 2016 (161.2)
- Gerrit Cole 2019 (160.1)
My model was built off of consecutive player-seasons of at least 250 batters faced from 2015-2018 (n = 541).
In looking at how predictive 2018 pK% was of 2019 K% compared to 2018 K%, one can draw the conclusion that predictive strikeout percent is marginally more stable and predictive than strikeout percent is, thus making it a valuable statistic.

Featured image- Creator: Mitchell Leff, Mitchell Leff | Credit: Getty Images

